
On average, Immunology and Microbiology, Neuroscience as well as Biochemistry, Genetics, and Molecular Biology have the highest citation rates.
Description
The number of authors per article in the subject area Immunology and Microbiology is 9.7 on average with a maximum of 83 authors. The mean number of coauthors is increasing by 0.4 per year in the respective time period (Figure 1). The articles in this analysis (n = 968) were cited 34.4 times on average with a maximum of 2938 citations which is the second highest value across the 27 subject areas according to our methodology (see below).
The number of authors per article in the subject area Neuroscience is 8 on average with a maximum of 342 authors (Figure 2). The mean number of coauthors is increasing by 0.5 per year in the respective time period, which is the second highest value across the 27 subject areas. The articles in this analysis (n = 1122) were cited 38.8 times on average and 924 as maximum.
The number of authors per article in the subject area Biochemistry, Genetics, and Molecular Biology is 16.7 on average with a maximum of 1269 authors, which are the second highest numbers across all subject areas. The mean number of coauthors is decreasing by 2.1 per year in the respective time period (Figure 3). The articles in this analysis (n = 818) were cited 33.4 times on average with a maximum of 1774 citations.
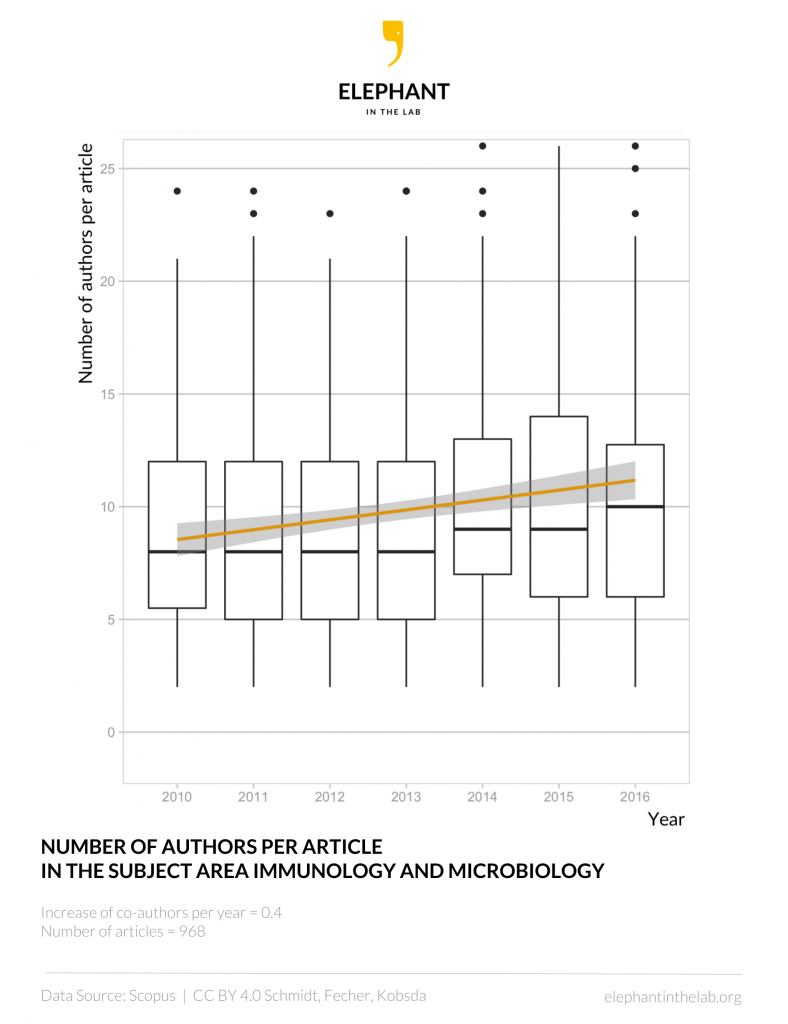
Figure 1: Boxplot of the number of authors per paper in the subject area Immunology and Microbiology. The box denotes 25–75% of the values with the median (bold line) in it. The small circles are outliers. Due to a limitation of the y-axis, some outliers are not shown. The yellow line shows a linear model of the mean number of authors per article with a confidence interval of 0.95 shown in light grey. Data source: Scopus. CC BY 4.0 Schmidt, Fecher, Kobsda.
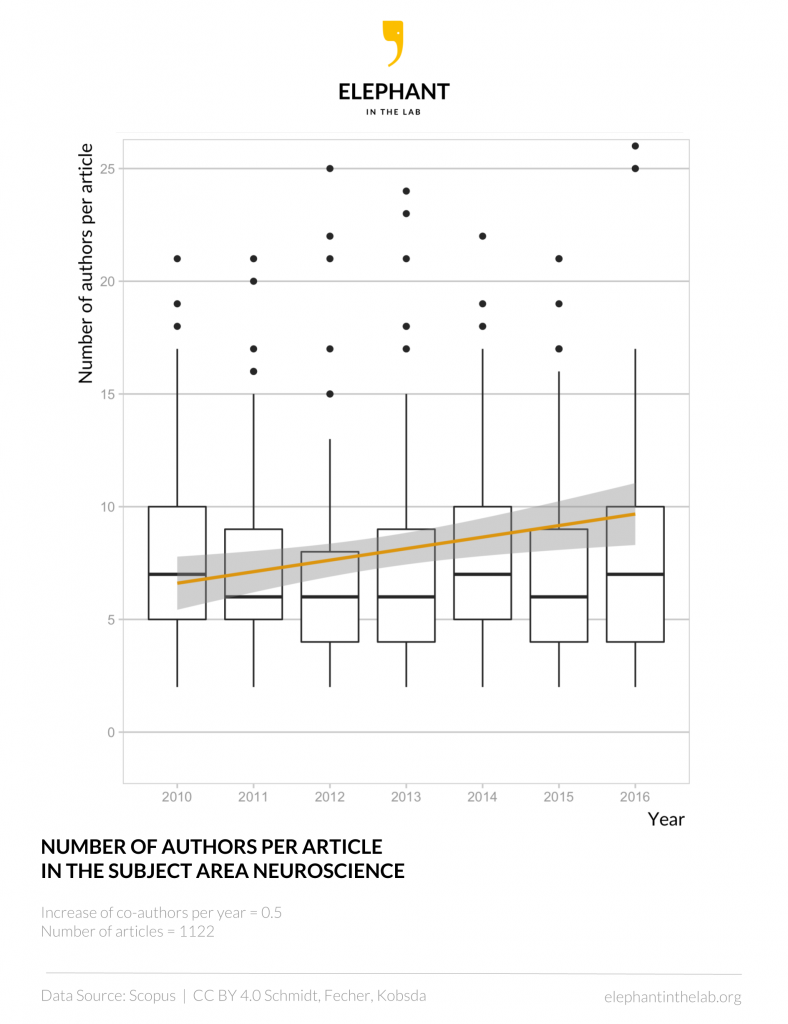
Figure 2: Boxplot of the number of authors per paper in the subject area Neuroscience. The box denotes 25–75% of the values with the median (bold line) in it. The small circles are outliers. Due to a limitation of the y-axis, some outliers are not shown. The yellow line shows a linear model of the mean number of authors per article with a confidence interval of 0.95 shown in light grey. Data source: Scopus. CC BY 4.0 Schmidt, Fecher, Kobsda.
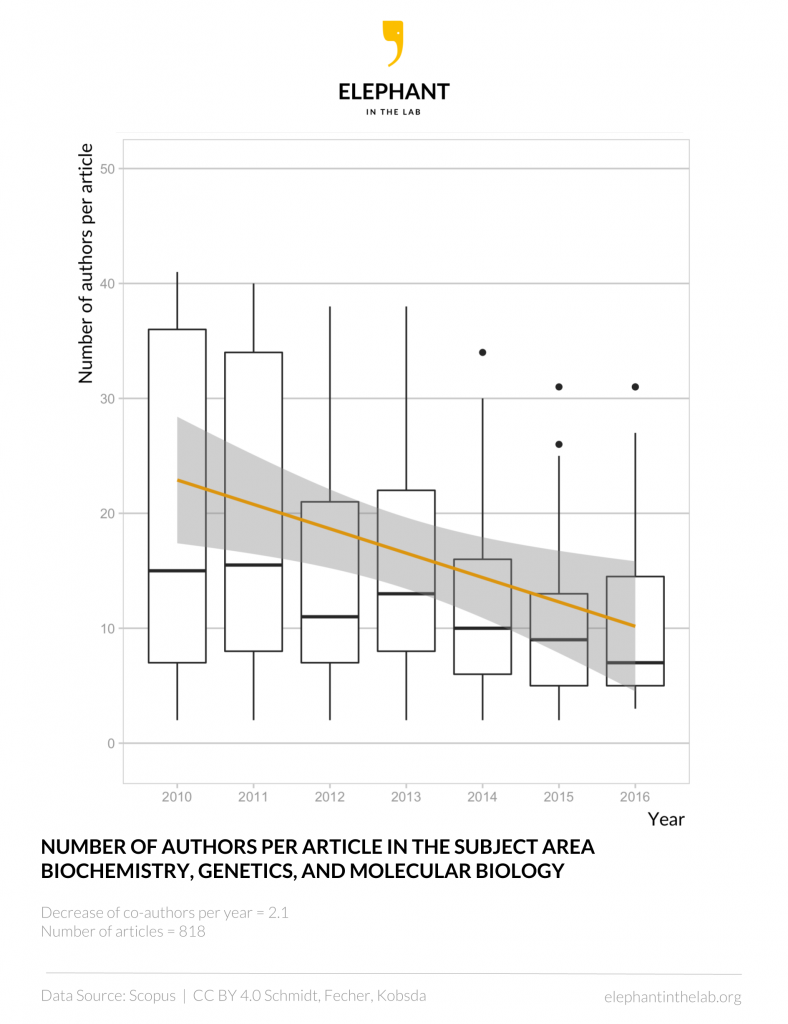
Figure 3: Boxplot of the number of authors per paper in the subject area Biochemistry, Genetics, and Molecular Biology. The box denotes 25–75% of the values with the median (bold line) in it. The small circles are outliers. Due to a limitation of the y-axis, some outliers are not shown. The yellow line shows a linear model of the mean number of authors per article with a confidence interval of 0.95 shown in light grey. Data source: Scopus. CC BY 4.0 Schmidt, Fecher, Kobsda.
Methodology
The results of the Advanced search in Scopus were restricted by an algorithm with
- a time period of publishing (2010 to 2016)
- the document types (articles or reviews),
- and a quantitative limitation regarding the publication output (articles by the 20 highest performing authors with the most Scopus listed articles in every subject area).
For details and code see Schmidt et al. 2017.